


OAS WEBvisuPORTAL
– the unlimited cloud automation solution
OAS WEBvisuPORTAL is the unlimited cloud automation solution, at one or more providers / data centers, for all applications and programs in our product portfolio.
– automation as a service

Portal software and hosting from a single source offer extensive advantages
With our portal solution, you no longer need your own server or server structure on site. The time-consuming and cost-intensive care and maintenance of your own server is therefore no longer necessary and is taken over by an OAS data center as a service. System failures and data loss of important information are a thing of the past.
Advantages
- No investment in new server hardware/infrastructure/software systems is required
- Your system is always up to date
- Risk minimization in staff provision
Service und Management
- Your requirements for 24/7 operation are thus realizable
- We offer managed services up to application management around the clock
- Adaptations and scaling of existing and new IT requirements of customer systems are easily realized
Requirements and Certification
- The data center is part of critical infrastructures and therefore TÜV tested and classified as highly available, level 3 (tekPlus) and ISO 27001 certified
- From firewall operation incl. VPN tunnel up to managed rack solutions
- Time- and cost-intensive TÜV and ISO certifications are no longer necessary
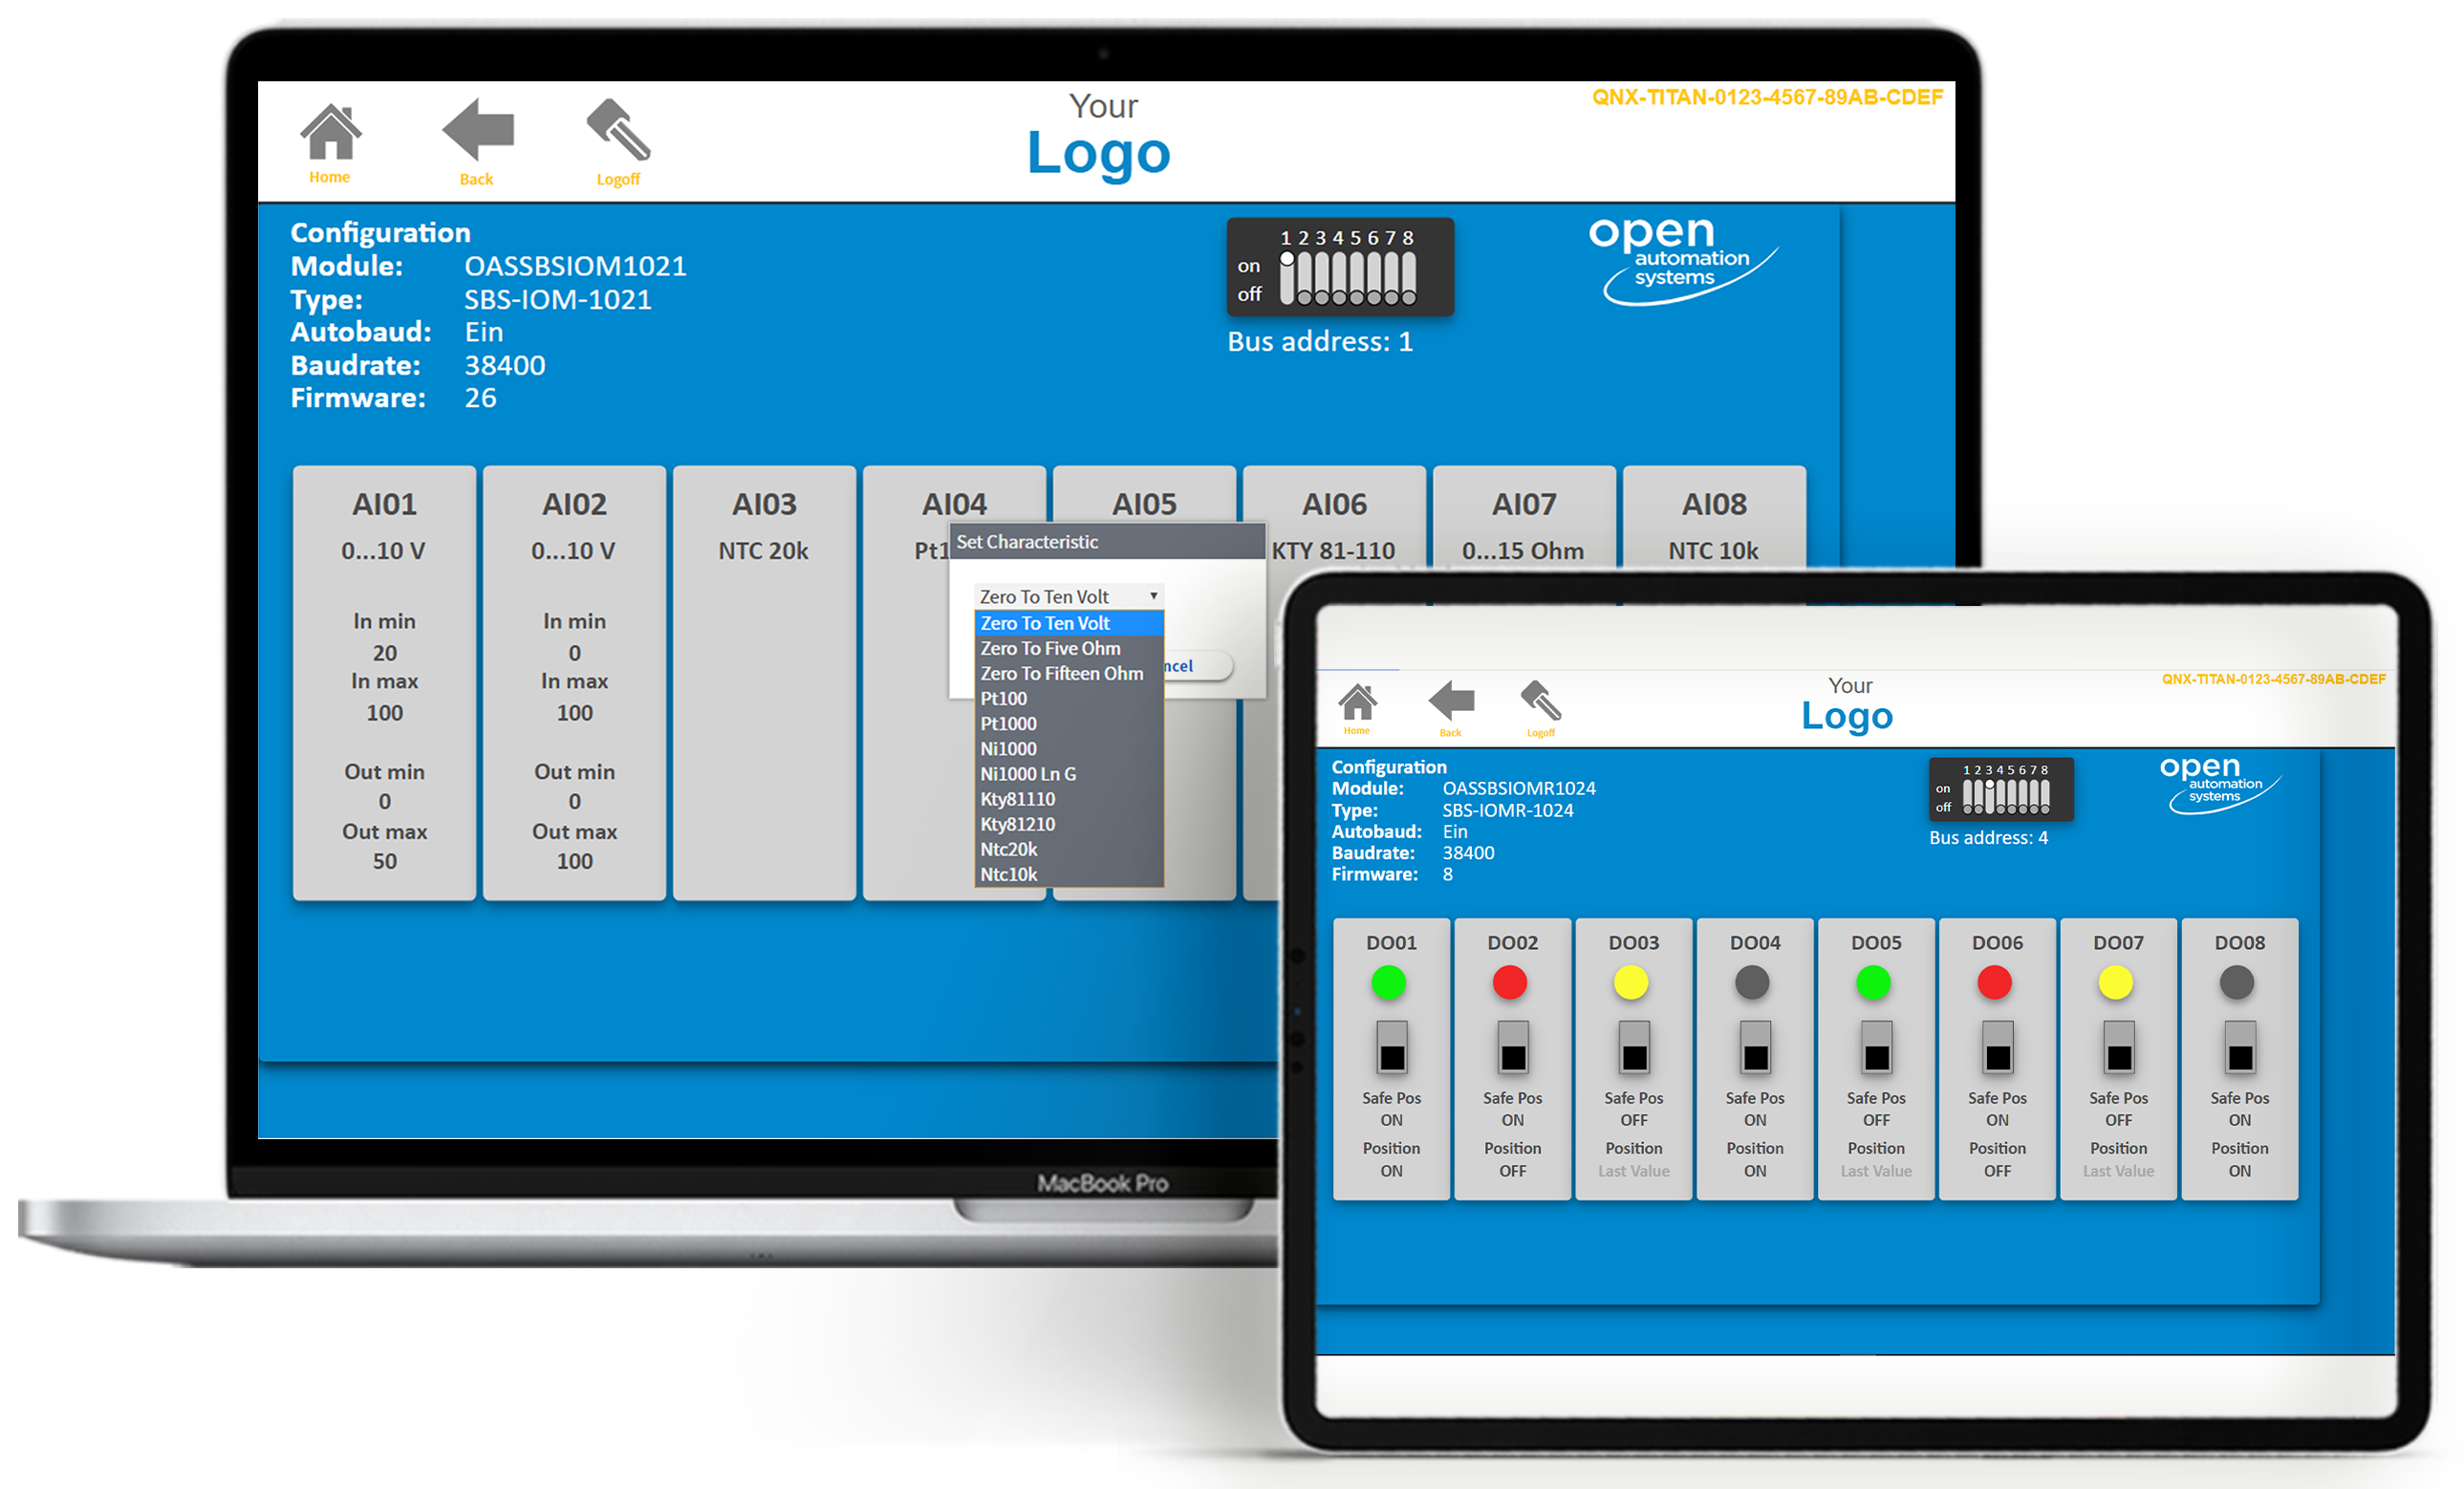
Ease of use with visual feedback
The display is optimized for web browsers or touch surfaces with graphic elements, which are built up as dynamic HTML documents by the WEBvisu server. Overviews of sites with green spaces and streets provide orientation when searching for specific buildings. We also have a wealth of experience in the visualization of entire facilities. Access to all system statuses, parameters and error messages is possible via a web browser with a high level of operating convenience. Authorized personnel can quickly and safely perform all configurations and settings and intervene if necessary.
Trending
Trending is used for the graphical representation of measuring points and plant conditions as a curve progression. Using the available trends, the user can compile the desired data and display it in a curve diagram with settings such as time period or time range. Individual data can be selected from "available trends" or from previously compiled and saved templates from "trends for all users". For a more detailed view a specific range can be selected. This zoom function limits the curve diagram to the selected range. The individual values of each curve are displayed in the legend.
System structure OAS WEBvisuPORTAL Hosting

More impressions of our OAS WEBvisuPORTAL

Trending curves OAS WEBvisuPORTAL

Scene control OAS WEBvisuPORTAL

Trending curves OAS WEBvisuPORTAL